Machine Learning and
Business Intelligent Systems
Empower your business with Machine Learning and Business Intelligent Systems for data-driven decision-making and competitive advantage.
MI and BI Solutions
Swartup Specializes in Machine Learning and BI Solutions!
Specifically in the realm of Business Intelligence (BI) integrations. With a strong focus on BI tools, analytics, data lakes, data warehousing, operational analytics, serverless data integration, and user-friendly data visualization, Swartup empowers businesses to harness the power of their data and make informed decisions.
-
ML and AI: Unleashing the Potential of Data
ML and AI revolutionize industries by unlocking the potential of data, driving innovation, and optimizing operations.
-
BI Tools: Enabling Data-Driven Decision Making
Harness the power of BI tools to make data-driven decisions and drive business success.


Enhance Process Quality Through the Utilization of ML and BI  Technologies
Machine learning and AI technologies have revolutionized the way businesses process and analyze data. Swartup's team of experts excels in leveraging these cutting-edge technologies to develop custom solutions that unlock valuable insights from data. By applying advanced algorithms and statistical models, we help organizations identify patterns, trends, and correlations in their data, enabling them to make accurate predictions, optimize processes, and drive business growth.
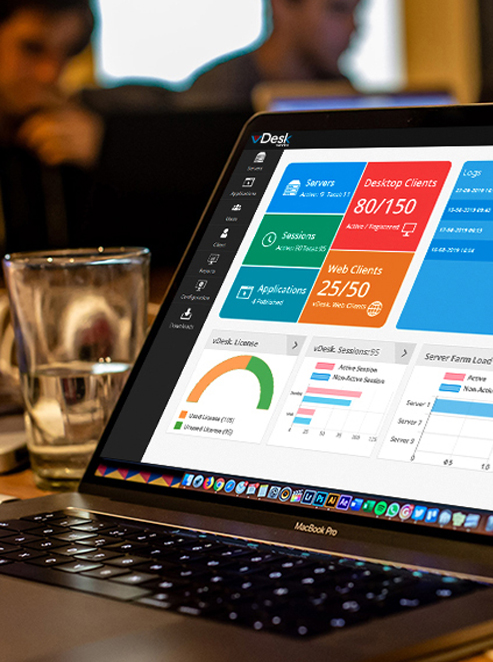
Business Intelligence (BI) tools are essential for organizations to access, analyze, and visualize their data effectively. Swartup specializes in integrating BI tools into existing systems, allowing businesses to gain actionable insights from their data. Our experts work closely with clients to understand their specific requirements and select the most suitable BI tools for their needs. We ensure seamless integration with data sources, configure dashboards and reports, and provide training and support to enable users to make data-driven decisions confidently.
Swartup excels in implementing analytics and data lake solutions that transform raw data into valuable insights. We help organizations establish data lakes, which are centralized repositories for storing and processing large volumes of structured and unstructured data. By leveraging data lake architectures, we enable organizations to perform complex analytics, extract meaningful insights, and drive data discovery.
Data warehousing plays a crucial role in aggregating and centralizing data from various sources for analysis and reporting purposes. Swartup helps organizations design and implement data warehousing solutions that ensure data integrity, scalability, and performance. Our experts leverage industry-leading data warehousing platforms to create robust data models, optimize data loading processes, and provide users with quick and accurate access to information.
Real-time insights are essential for organizations to make proactive and informed decisions. Swartup specializes in operational analytics solutions that enable organizations to monitor and analyze their operational data in real-time. By leveraging technologies such as event streaming, in-memory computing, and predictive analytics, we empower organizations to identify emerging trends, detect anomalies, and take immediate actions to optimize operations and enhance customer experiences.
Data integration is a critical aspect of BI, as it involves consolidating data from various sources into a unified view. Swartup excels in serverless data integration, leveraging cloud-based technologies to simplify and streamline the data integration process. Our experts design serverless architectures that automatically scale based on demand, reducing infrastructure costs and enabling organizations to focus on data integration without the burden of managing servers.
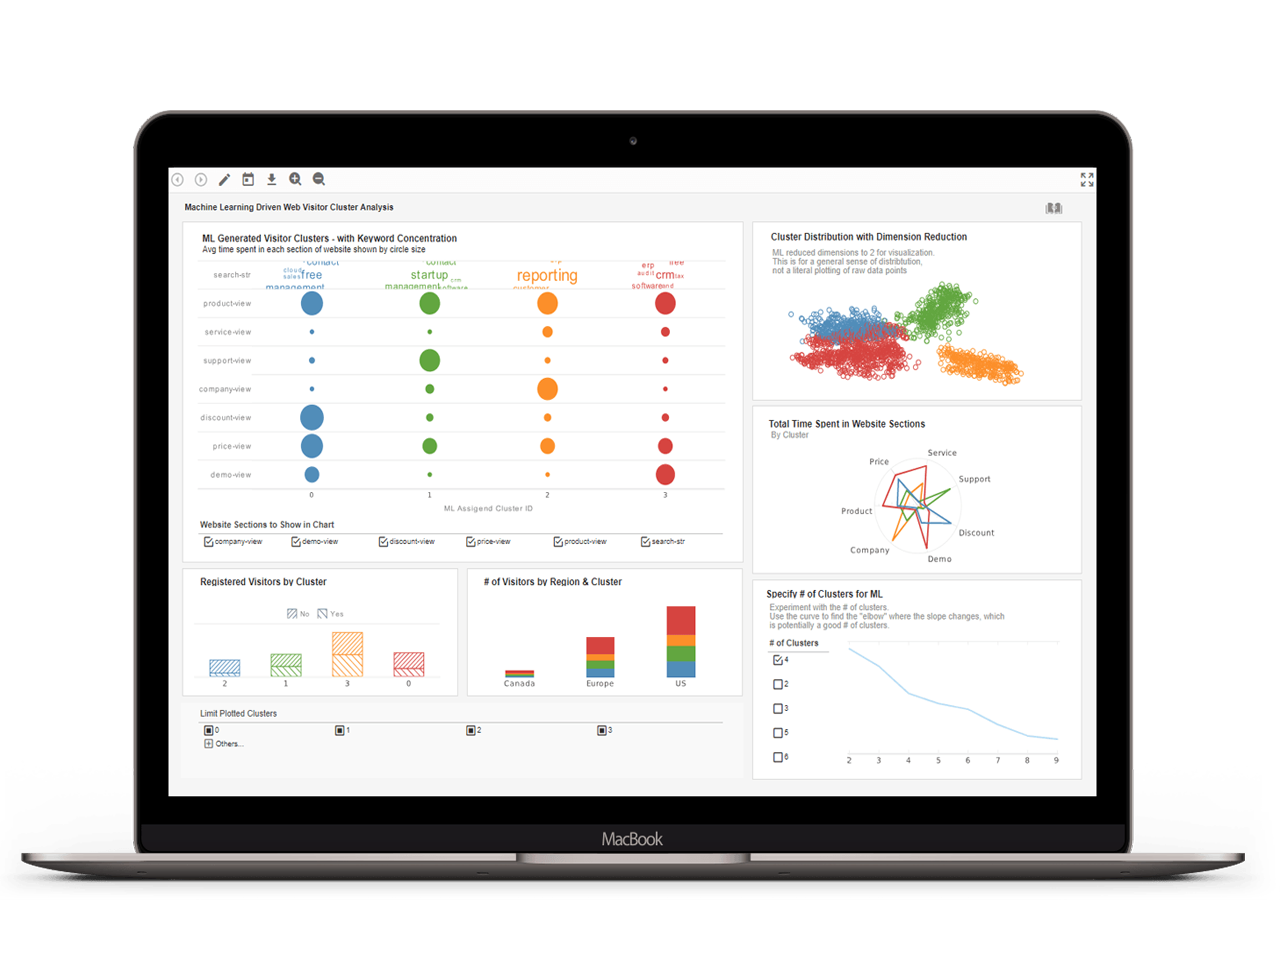
Data visualization is key to making complex data accessible and understandable for users across an organization. Swartup specializes in developing user-friendly data visualization solutions that transform data into meaningful visual representations such as reports, dashboards, charts, and graphs. By presenting data in a visually appealing and intuitive manner, we enable users to analyze information, identify trends, and make data-driven decisions effortlessly.


